01/10/2024

President Biden’s AI Executive Order required his Council of Economic Advisers (CEA) to develop an empirical model which could track and predict the impact of AI on the US labour market. The CEA recently released a report which, while early days, identifies current and potential differential impacts of AI by income levels, education, job skills, gender, and urban vs rural locations.

The CEDA starts with a big caveat – it thinks that, as with earlier technology waves AI will be a positive overall for the US labour market:

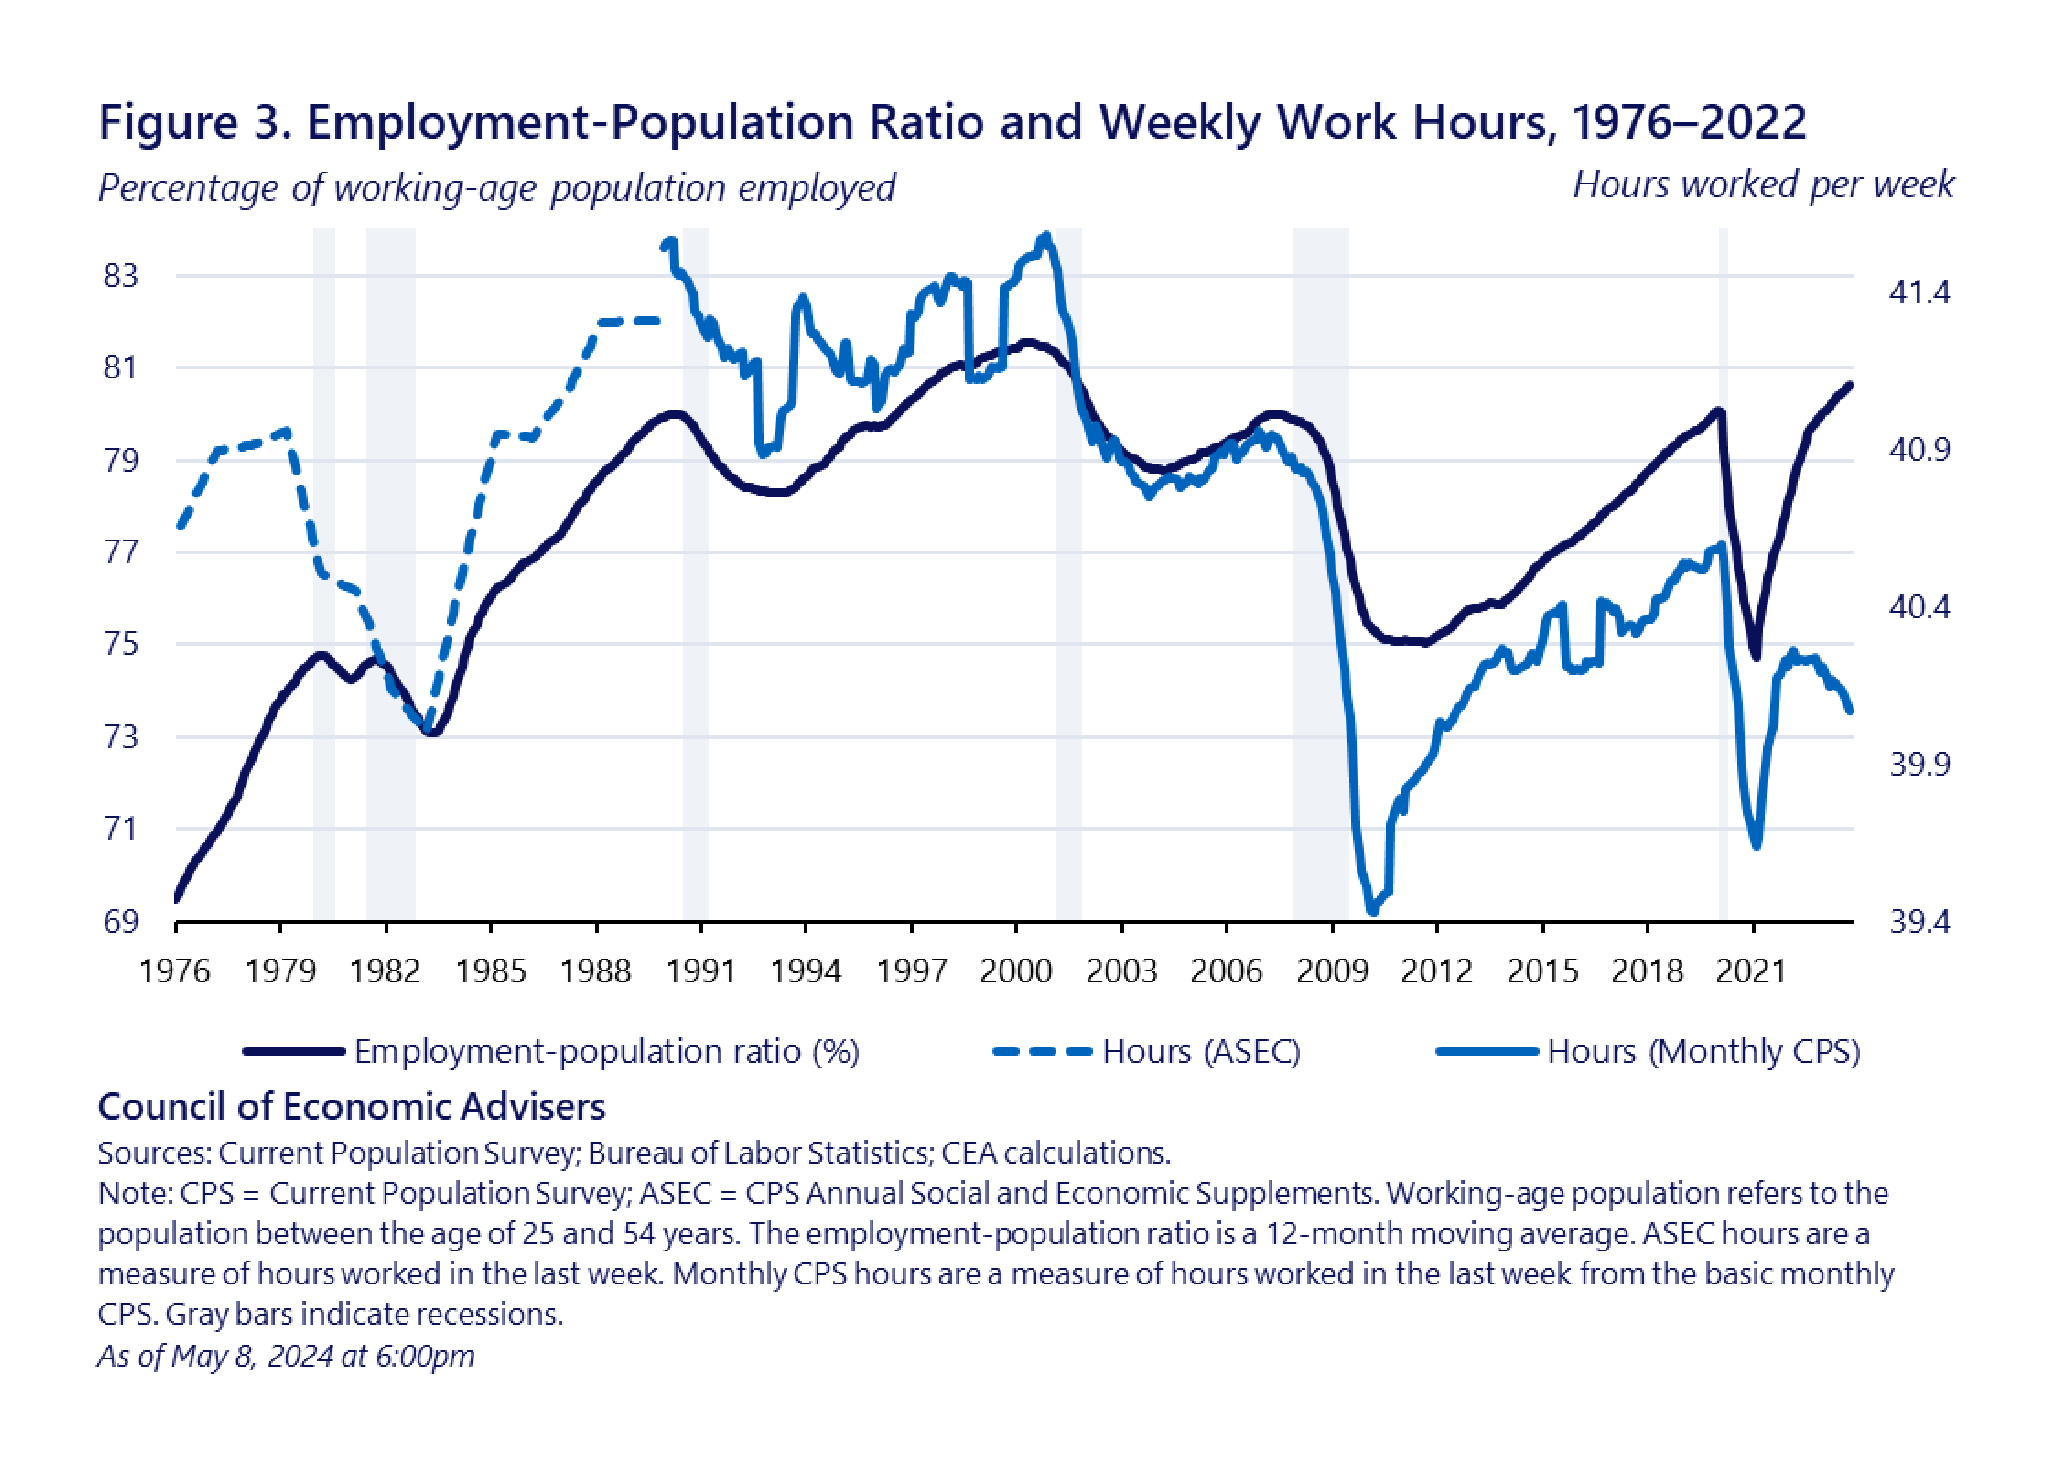
“Economists and others have predicted for centuries that technological change might lead to widespread technological unemployment or drastically reduced hours of work. Yet, as [the figure below] demonstrates, measures of employment such as the working-age employment-population ratio and average hours of work show little evidence of decline in recent decades. In fact, the employment rate remains close to long-term highs, matched only by a period in the late 1990s in which technological change and productivity growth was also rapid, commonly associated with the previous general-purpose technologies of the personal computer and internet adoption.”

Instead, the CEA is focused on identifying whether there will be an uneven impact of AI across different types of work: who will be the winners and the losers.

CEA’s methodology

The CEA observes that predicting the labour market impacts of general-purpose technologies like AI is much more challenging than for new specialised technology tools which have a one-to-one correlation with individual manual job tasks. The CEA gives the following old world example:

“The Luddites foresaw that new textile machinery such as the power loom would negatively impact wages and labor standards among skilled textile workers, and they destroyed that machinery in response. General-purpose technologies are distinguished not only by the breadth of their potential applications, but by the way in which they create new opportunities for improvements in other sectors for example, underpinning the adoption of technologies like the power loom was the steam engine, a general-purpose technology that could be adapted to many different purposes throughout the economy. Even as some use cases like the power loom negatively impacted some skilled craftspeople, a major effect of the steam engine was to draw farm workers into factory labor, and this likely increased the overall demand for skill in the economy.”
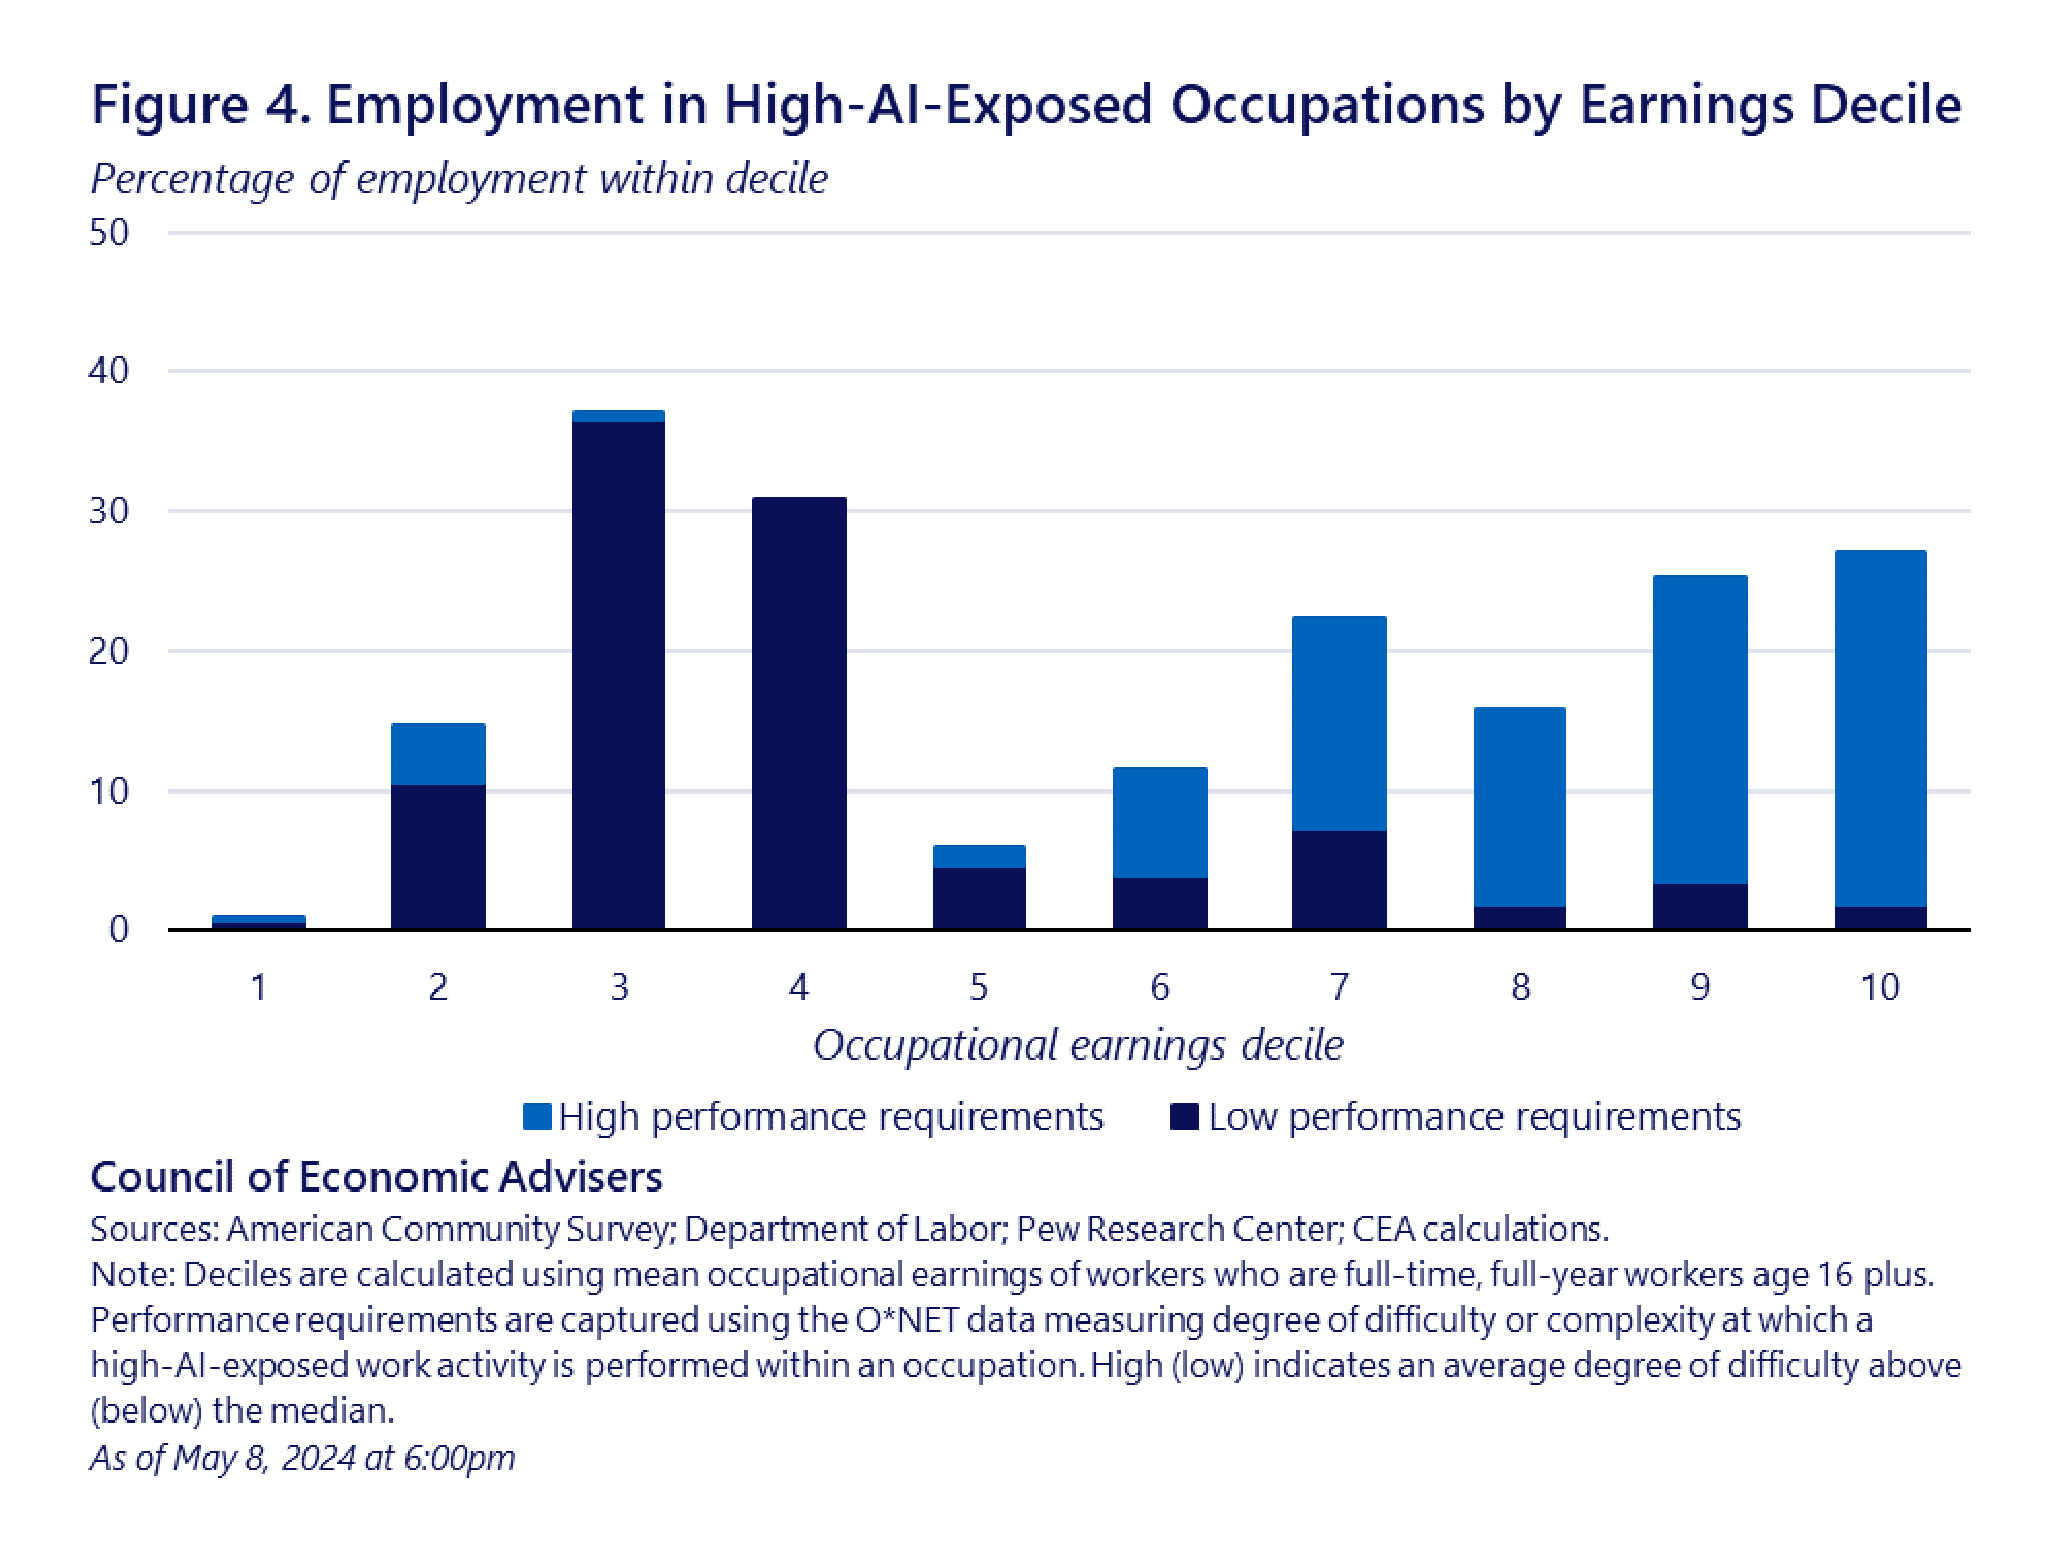
The CEA’s model builds on earlier labour models in which changes in patterns of economic activity across workers over time are corelated with an underlying characterisation of how a technology works, and with the timing of that technology’s adoption. This index of the degree of alignment between work changes and technology across different job categories over time then can be applied to labour economics data, such as unemployment rates, wages, and hours worked to identify trends which inferentially are related to the technological change. The CEA acknowledges this is a mixture of theory and available empirical evidence.

The CEA develops two measurements: a score of the AI exposure, which is a measure of the extent to which AI currently is used or could be used in a job, and a score representing the degree of AI-related performance requirements, which is a measure that considers the future potential for AI to complement or substitute for human performance of job.

The AI exposure is assessed as follows:

  • Building up a profile of work activities comprised in each job based on 41 distinct standardised activities about which individuals in all occupations are asked, with a ranking of relative importance of each relevant task in the job profile. 
  • Identifying from the list of 41 tasks, the tasks which, at the time of measurement, are assessed on the current capabilities of AI as having a high exposure to AI (for example could be readily used to perform or assist in the task).
  • The CEA currently assessed 16 tasks as being highly exposed to AI, including getting information, scheduling work and activities, monitoring and controlling resources, and a little more surprisingly, thinking creatively and working with the public.
  • The number of AI exposed tasks and their relative importance of those tasks in the job profile gives the score for the job’s overall current AI exposure.

This is a standard approach used in other studies of technology’s job impact. The innovation in the CEA model is the second parameter, the degree of AI-related performance requirements. This is based on the following assumption:

“CEA’s… AI-related job performance requirements use information from a [US Government labour database] about the degree of complexity or difficulty to which each work activity must be performed in order to perform one’s overall job. The underlying assumption guiding this measure is that complexity and difficulty are closely related to costs of adoption. If it is more costly and difficult for AI to fully substitute for human performance of an activity, then using AI to complement performance of that activity may be more feasible or cost effective than using AI to fully automate the activity.”

Combining these two parameters, the CEA sorts the list of standard occupations into three categories:

  • AI-exposed with high AI-related performance requirements: CEA assumes AI is more likely to be a tool used by these employees to enhance their work, as not a substitute for their jobs.
  • AI-exposed with low AI-related performance requirements: by contrast, CEA assumes these jobs will be vulnerable to AI substitution in whole or large part.
  • Not highly AI-exposed: these jobs may be safe currently from AI, but as they tend to be low skilled, many will be vulnerable to technology or economic change.

Mid-skilled jobs are in the AI substitution frame

The following table lists average occupation-level AI exposure and AI-related performance requirements across a range of occupational groups:

For example, architecture and engineering occupations are currently the most exposed to AI, with AI-exposed activities being half as important in the job mix in comparison to the general population.

At the same time, the AI performance requirements score for architecture and engineering occupations of 0.81 implies that on average, AI-exposed activities of these workers must be performed with a degree of difficulty or complexity that is more than four fifths above the population mean. For this reason, although 90 percent of workers in this occupation group meet CEA’s threshold for high AI exposure, only 4 percent of these workers are classified as also having low performance requirements, and therefore will be potentially vulnerable. So, the good news for almost all architects is that they are safe, AI will be a tool not a substitute.

By contrast, office and administrative support have an above average AI exposure and below average degree of AI performance requirements, meanings nearly half of employees are at risk of being substituted by AI.

Food industry employees have the benefit of below average current exposure to AI into their job tasks and, while the level of AI job performance is also low, their jobs seem safe because AI won’t intrude into their workplaces.

The socio-economic impacts of AI

The CEA analysis seems to bear out concerns that AI could worsen current income disparities. The following graph shows the highest percentage of current employment in highly AI-exposed occupations occurs in the lower-middle portion of the occupational earnings distribution. In the third and fourth occupational earnings deciles, more than a third of workers are exposed to AI.

Individuals in the top two deciles are also comparatively likely to have high AI exposure.

The telling difference is that workers in higher-earning AI-exposed occupations have on average much higher AI-related performance requirements than workers in lower-earning occupations. Those in the upper income levels will not only keep their jobs, but AI may well assist them earn more of the pie.

AI’s impact on the historically disadvantaged

The following figure shows that although a substantial proportion of workers from all major demographic groups are in jobs with AI exposure, there are some demographic differences. For example, women are slightly more likely to have high AI exposure in their jobs than men.

The real concerns are the demographic patterns observed among all AI-exposed workers whose jobs have lower AI performance requirements and therefore are more vulnerable to substitution. Workers in these jobs are disproportionately likely to have only a high school diploma while workers with four-year degrees tend to be employed in jobs with higher performance requirements. Women are substantially more likely than men to be employed in high AI-exposed occupations with low performance requirements.

Urban vs rural

As economic activity in service and manufacturing sectors tends to cluster in urban areas, it's not surprising that overall AI exposure is highest for jobs in the densest populated areas. On the other hand, employment of potentially vulnerable workers (who are both highly AI-exposed and with low AI-related performance requirements) is negatively associated with local population density. For example, more vulnerable employees are located outside the more densely populated areas. These jobs tend to be in suburban areas, and not in rural areas because rural jobs tend to be both low AI exposure and low AI performance scores. While this means rural workers, such as in agriculture, may be ‘safer’ from the threat of AI substitution than workers in fringe urban areas, those rural jobs are low paid because they are low skilled.

The CEA points out some surprising geo-location results:

“Some regions with among the highest AI exposure—such as portions of Silicon Valley—have among the lowest rates of AI-related performance requirements in the country. This suggests that the places that may be most at risk of substantial AI-related displacement could be quite different from the places where AI is simply being widely used.”

All those ‘helpers’ enabling the geeks’ lifestyles!

Does the trend data support this vulnerability analysis?

The CEA thinks it is probably too early tell the impact of AI employment substitution on vulnerable workers because firms are too early in their uptake and implementation of AI, but there are some worrying early signs. The CEA notes that groups which it has identified as being most vulnerable to AI, have been going backwards for several decades, and that gap is now widening at a faster pace although it is hard to tell how much is pandemic related compared to AI-related:

“Employment growth of AI-exposed occupations with low performance requirements has been consistently slower than that of occupations with high performance requirements for nearly two decades, as well as of occupations which are not highly exposed to AI. In early periods, employment growth across these three groups was largely in parallel. They also responded similarly during the Great Recession and subsequent recovery.

However, in more recent years, there has been some divergence in growth patterns across the three groups. The gap in employment group between the high- and low-performance requirement groups increased substantially in the latter portion of the last decade. And, employment in the non-exposed group declined more strongly and recovered more quickly from the pandemic recession period, potentially reflecting differences in the working environments of AI-exposed and less-exposed employment. Employment growth between 2021 and 2022 was again largely in parallel, although this finding is challenging to interpret in light of the ongoing pandemic recovery at that time.”

Is there a silver lining?

Finally, the CEA cautions that just because its analysis identifies a group of employees as ‘AI vulnerable’, it does not mean that will come to pass.

First, enduring unemployment may not be necessarily the outcome of AI substitution for a current job: workers may respond to the impacts of new technology by changing jobs or occupations. The US Labor Department collects data about the same workers in two adjacent years, and this permitted the CEA to run its AI exposure and AI performance requirements scores at multiple points in time, including for workers moved to a new job. While again early days, the CEA found some good news:

“Regardless of their initial occupations, workers are increasingly likely to have transitioned to an AI-exposed job with high AI-related performance requirements, and decreasingly likely to have transitioned to an AI-exposed job with low AI-related performance requirements. Workers who start out in a high AI-exposure, high performance-requirements job are increasingly likely to remain in the same occupation. Conversely, workers who are employed in low performance requirement jobs are increasingly likely to change occupations.”

Second, employees may be upskilled in their current jobs to handle AI. The CEA found over the last 15 years there has been a marked increase in the average performance level required for the AI-exposed tasks and other tasks as well. This suggests there is a general upskilling at work across the US economy rather than being AI-specific. The CEA observes its analysis “implies that about 80 percent of the increase in AI-related performance requirements from 2007 to 2022 was attributable to within-occupation changes in occupational content, rather than to shifts in employment across occupations”. Suggesting employees in current their jobs can rise to the changes in the US economy – potentially AI as the next wave.

However, the picture is more mixed when looking at jobs with different skill levels. The CEA observes:

“[T]he complexity and difficulty of many AI-exposed occupations with low performance requirements have changed little since 2007, and this is reflected in the near zero change for the median worker in that category. On the other hand, the median worker in an AI-exposed job with high AI-related performance requirements has seen those requirements increase over time.”

In other words, workers in mid-skilled jobs who otherwise would be AI vulnerable may be able to upskill their way out of vulnerability, but this may be less so with the lower skilled workers.

Conclusion

The CEA’s overall assessment is:

“The potential benefits from AI are substantial. Many workers are likely to benefit from use of the technology, and productivity gains could substantially improve economic wellbeing overall. Nonetheless, a subset of workers may be at risk of displacement, declining earnings, or other negative economic outcomes in response to the technology’s adoption. Identifying such vulnerable workers in advance as CEA’s measure attempts to do may help to ensure that policies designed to help them transition or otherwise adapt in response to AI are efficiently targeted and executed.”

The CEA’s analysis illustrates the broader social equity impacts of AI. The widespread sense of being left behind is already fraying our social fabric. While the Australian Government’s proposed AI principles refer to the impact of AI on social groups, as well as individuals, it may be worth considering a more explicit objective of ensuring AI promotes social equity, along the lines proposed by Harvard Kennedy School’s Ash Centre for Democratic Governance and Innovation:

“[W]e need technology that expands human capacities rather than supplanting the place of human beings in the productive structure of the economy.”

Read more: Potential Labor Market Impacts of Artificial Intelligence: An Empirical Analysis

""